
Statistics and weather data, or what was unknown in 1959
02-02-2024
Source Climbers from the Northern Capital
In those now-distant years, statistics hadn't been compiled to provide a clear understanding of what causes and can cause ski tourists to die. There was also no well-founded understanding of which risk factors were primary and which typically didn't lead to fatal accidents. But now such statistics exist, and they allow us to accurately identify the most critical risk factors and understand the types of exposures that lead to ski tourists' deaths.
From Mikhail Vasiliev and Valentin Nekrasov, we received data on accidents in ski tourism over 30 years - they are published on the website mountain.ru and on the website of the Tourist Union of Russia, as well as in the newspaper "Volny Veter", No. 66 for 2004, (p. 3, article by M. Vasiliev "Neglect of personnel training does not go in vain"). The data is eloquent - according to them, avalanches account for up to 80% of fatalities, and avalanches and freezing account for more than 90% of those killed in ski trips. Another 7% are caused by falls on the slopes. The remainder is caused by illness (from 1 to 4% in different years). It's also known that 28 people died on ski trips from 1992 to 2004, 24 of them in avalanches, or 6 out of 7 fatalities (86%)! Here's a table of these data, containing statistics on the causes of skier deaths, and the figures are easy to draw conclusions from.
Table 1. Ski Trip Deaths from 1971 to 2004 inclusive
| Год | Death toll and causes | |||||
| Total | Daily hikes | Avalanche | Hypothermia | Fall | Sickness | |
| 1975 – 1990 | 83 | 72 | 65 | 10 | 6 | 2 |
| 1991 – 2004 | 24 | 24 | 2 | 2 | - | |
| 1975 – 2004 | 111 | 96 | 89 | 12 | 8 | 2 |
| Total, % | 100% | 86,5% | 80,2% | 10,8% | 7,2% | 1,8% |
| Supplement: data from V.A. Nekrasov on accidents in 1971–1990 | ||||||
| 1975 – 1990 | 124 | 78 | 32 | 9 | 5 | |
| Total, % | 100% | 62,9% | 25,8% | 7,3% | 4,0% | |
It's clear that avalanches, cold, falls, and illness are the main dangers of ski trips. No fatalities have been reported from other causes. The more severe the accident, the more strongly it is included in these statistics, since it is much more difficult for the elements to "break" an entire group than an individual, as long as the group remains united. This is precisely why, in serious group accidents, a combination of factors comes into play, as in the Dyatlov group accident: technical errors, avalanches, injuries, loss of equipment, cold and wind (and generally harsh environmental conditions). Only a very high-energy impact can quickly destroy a group. Avalanches, cold, and wind possess such energy, and this energy becomes deadly if a group loses their artificial habitat, such as camping gear and clothing.
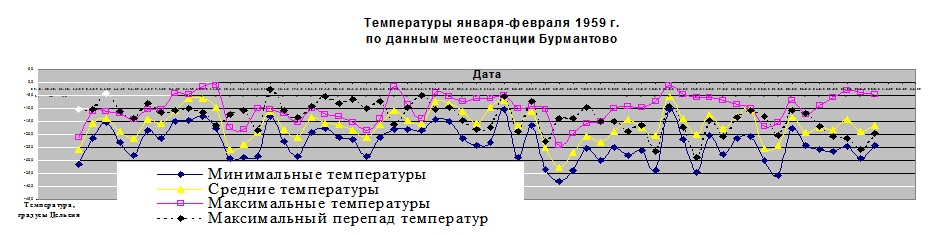
We know the "energy" of the cold both on the night of February 1st and 2nd, 1959, and throughout the winter of 1959. This data from the Burmantovo weather station was provided to us by Ural hydrologist Dmitry Evgenievich Klimenko. The temperature distribution during January and early February is shown in the two graphs below. The minimum, maximum, and average temperatures are shown, along with temperature fluctuations over the course of a day and two consecutive days to assess the nature of temperature changes.
And we received weather images from engineer V.I. Moshiashvili at the Russian State Hydrometeorological University (RSHU, St. Petersburg).
During a consultation with geographer Professor K.V. Chistyakov regarding avalanches (described below), he carefully examined a weather map with the distribution of atmospheric barometric characteristics found online. However, he didn't draw any definitive conclusions during the conversation. He only said that the "position of the cyclone front" was visible. It became clear that the geographer, for some reason, was unable to draw a clear conclusion from this "weather map," and it was clear that the map "didn't tell him everything." This prompted the idea of finding an experienced meteorologist to whom the map could "tell" more, and who could find other maps to draw more definitive conclusions. So, the Russian State Medical University began "looking for a meteorologist," and they first found Associate Professor Grakhovsky, and through him, engineer Moshiashvili. Moshiashvili has produced new maps, tables, and graphs—not just with pressure data, but also with temperature, humidity, cloud cover, and other weather parameters for the days before, during, and after the accident. The data is very interesting.
- 2 -
Using weather maps, we traced the path of an Arctic cyclone with a cold air front, which caused a sharp drop in temperatures at the junction of February 1 and 2, 1959, in the area of the accident. Below are temperature maps for the critical days of the accident, from 8:00 PM (UTC) on February 1 (1:00 AM on February 2, Sverdlovsk time) to 2:00 AM on February 2 (7:00 AM on February 2, Sverdlovsk time). Also included are graphs of temperature changes in Burmantovo for a month before and after the accident, and tables of weather data in Ivdel and Nyaksimvol on the night of the accident. These three weather stations were the closest to the accident site at that time. The approximate location of the accident (61.75º N (69 º45'); 59.42º (59º25') E) is marked on the maps with a red cross in the upper right corner of the maps - it is close to the intersection of the 60-degree parallel and meridian of the coordinate grid plotted on these maps.
 |  |  |
| Klimenko Dmitry Evgenievich, Perm, leading hydrologist | Moshiashvili Vladimir Isaakovich, St. Petersburg leading engineer of the Russian State Medical University | Grakhovsky Georgy Nikolaevich, St. Petersburg, associate professor of the Russian State Humanitarian University |
From the temperature graphs, we have traced that in January before the accident, on 1-2.02.59, there were three noticeable temperature increases: on 10-11.01.59 to minus 1.3 °C, on 24.01.59 to minus 1.6 °C, and on 31.01-01.02.59 to minus 4.9 °C, the last increase immediately before the night of the accident. It's clear that these thaws were accompanied by the passage of fronts and the recrystallization of snow, forming "snow slabs" on a weak, deep hoarfrost base (this is an indirect sign of a possible avalanche hazard).
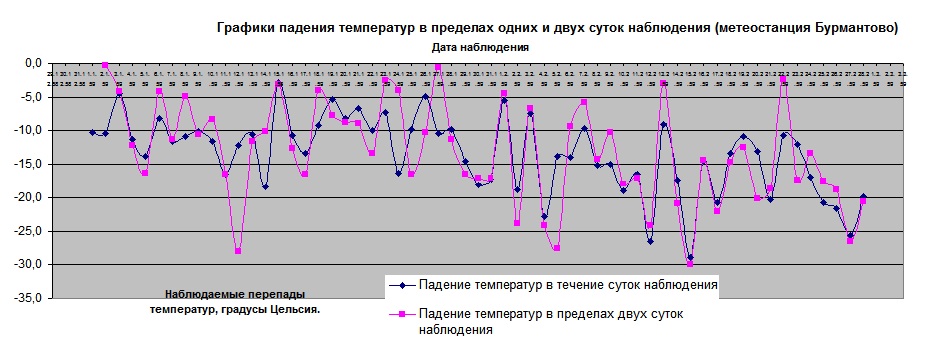
According to the graph of daily and two-day temperature changes (Burmantovo), we noted that at the end of February 1, 1959, there was a sharp drop in temperature from -4.9°C during the day to -28.8°C—a drop of -23.9°C within two days. Moreover, a drop of -18.9°C during the night at the beginning of February 2! Clearly, when daily and two-day temperature changes and their dynamics are close and the curves are "close together", the maximum temperature changes are observed at the junction of these days within the same night.
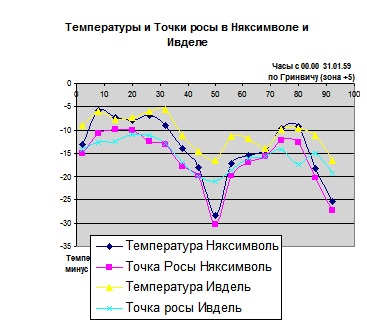
| Date | UTC time | Cloud height m | Weather characteristics | Wind direction azimuth | Wind speed m/s | Temp. °C | Dew point °C | Pressure hPa | |
| Weather Nyaksimvol (60°21'N, 41', 60°54’E) | |||||||||
| 01.02. 1959 | 20:00 | 2000-2500 | Light continuous snow | clear | 0 | 0 | -18.0 | -19.9 | 1010.700 |
| 02.02. 1959 | 2:00 | 2000-2500 | Snow in the last hour | clear | 0 | 0 | -28.4 | -30.2 | 1011.500 |
| Weather in Ivdel (60°41'N, 41', 60°27’) | |||||||||
| 01.02. 1959 | 20:00 | >2500 | The clouds are breaking | clear | 270 | 2 | -14.6 | -20.0 | 1009.900 |
| 02.02. 1959 | 2:00 | 2000-2500 | Clouds are developing | clear | 290 | 4 | -16.5 | -21.2 | 1011.100 |
And when the graphs diverge significantly, the maximum differences are observed either within individual days or at the junctions with other boundary days. This is evident from the nature of the temperature changes. It can be seen that the temperature difference between 01-02.02.59 is very sharp, but not maximum: at the junction between 04-05.02, an even more powerful drop "to minus" was observed, by 27.6 °C – to minus 38.1 °C from a maximum of minus 10.5 °C. This was the passage of the next, more powerful Arctic cyclone to the east, visible on the weather maps below. And even later, between 13-14.02.59, a very large temperature difference of minus 30 °C was observed, from minus 4.7 to minus 34.7 °C. True, it was less dramatic than the changes on February 1-2 and February 4-5. The graphs show a lesser steepness, and the temperature change occurred over a slightly longer period than at the beginning of the month.
Clearly, the mountain conditions on the slopes of Kholat Syakhl differed somewhat from those at the Burmantovo weather station, located in the taiga zone. Temperatures at an altitude of 900 meters could be either lower or higher, but the wind was noticeably stronger. This is because a cold front is clearly passing due to the abrupt change in temperature at the turn of the day, with a sharp drop and then a surge in atmospheric pressure. It is clear that even a seemingly mild wind of 4–6 m/s reduced the wind chill index (an equivalent characteristic of low temperature taking into account the influence of wind) to minus 43–minus 51, and a group of tourists in such conditions found themselves in a danger zone, struggling to survive even with winter clothing.
- 3 -
Data obtained later from engineer V.I. Moshiashvili at the Ivdel and Nyaksimvol meteorological stations roughly replicate the temperature data from Burmantovo. In Ivdel, the temperature drop was less noticeable, reaching minus 16.5°C. But in Nyaksimvol, it was practically the same as in Burmantovo, reaching minus 28.3°C. Wind speeds reached 9 m/s, with the wind direction predominantly westerly and northwesterly, with an azimuthal direction of 270-320°. This direction was confirmed by the location of the adiabats on the pressure field map above, since the wind is usually directed at an angle of 30° to the adiabat direction with the cyclone swirling counterclockwise on the map and the anticyclone swirling clockwise. Temperature and pressure graphs and a table of meteorological parameters are provided in the tables.
Data from the western weather stations of Troitsko-Pecherskoye, Perm, and Biser do not show such sharp temperature jumps, although a spike was also observed at Troitsko-Pecherskoye. Further west, temperature conditions were less severe (especially in Perm). However, these weather stations were located 3-4 times further from the accident site than the eastern weather stations (see diagram below), so their data are less significant.
A check of data from the Pechora weather station also showed a temperature spike to minus 28.7 degrees Celsius just before the junction of 01-02 February 1959, and a longer-lasting spike than that recorded by more southern weather stations.
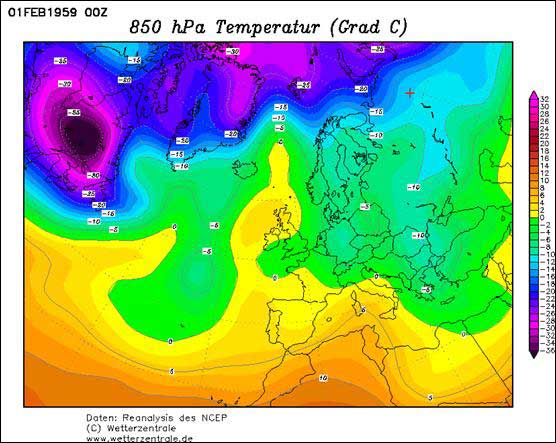
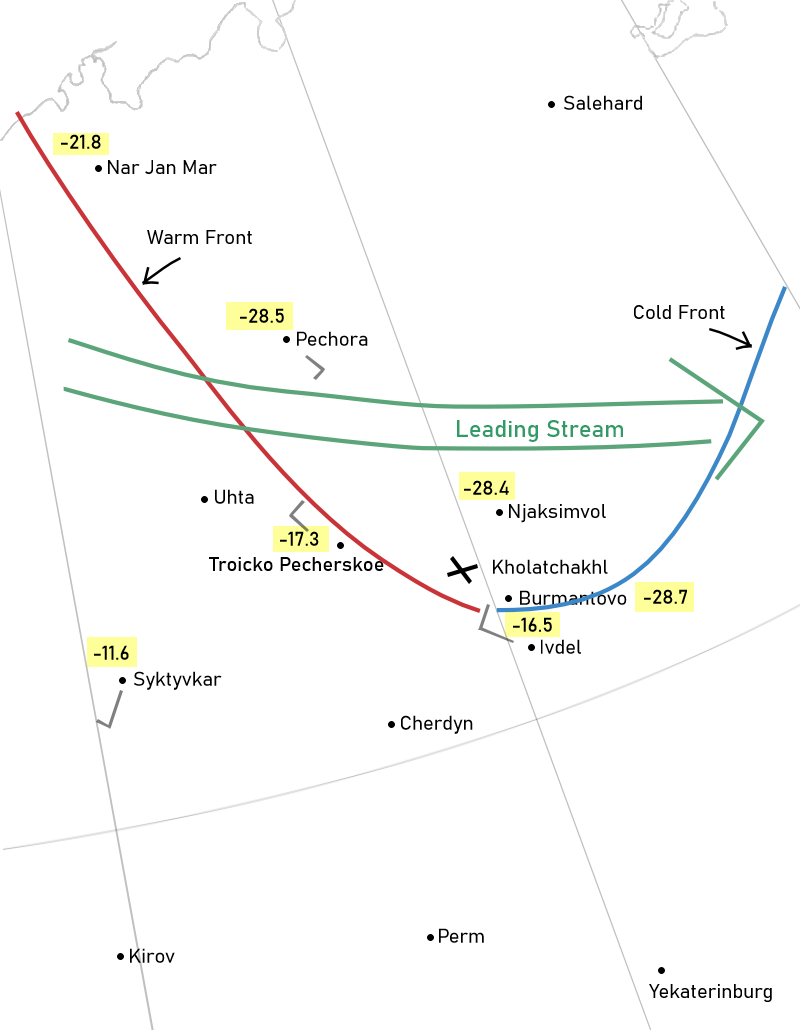
Temperature picture on 01.02.59 at 00:00 UTC (Greenwich Mean Time)
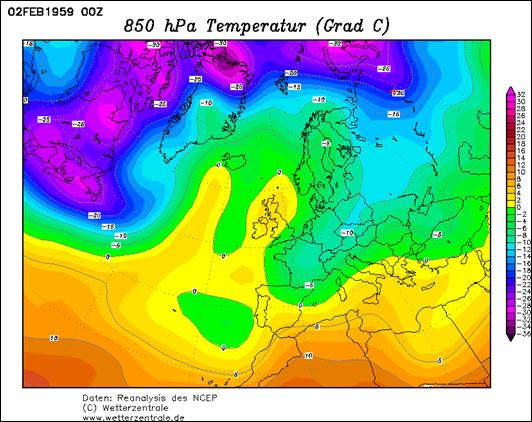
Temperature pattern on 02.02.59 at 00:00 UTC (Greenwich Mean Time) Cold front invasion pattern at 5:00 local time
According to Associate Professor Grakhovsky, based on temperature charts and a pressure map, a cold air front was observed passing on the night of February 1-2, accompanied by increased winds, a rise in pressure (after a previous decline), and some precipitation. The heavy mass of cold air pressed downwards like a wedge into the warmer air mass, which was rising. Meteorologists noted that Mount Kholat Syakhl created a "screen" effect, and the wind was somewhat weaker on its eastern slope than in open areas far from the mountainside.
By analyzing the climate, Moshiashvili determined that a cold front was moving from the northwest to the southeast. The cold air zone did not penetrate far south, and temperatures at Troitsko-Pecherskoe and Ivdel did not fall below minus 20 degrees Celsius. However, slightly north and east—in Pechora, Nyaksembola, and Burmantovo—a peak temperature drop to minus 28 degrees Celsius was recorded. These weather stations provide the most accurate temperature readings at the accident site. The maximum temperature in the accident zone can fluctuate by plus or minus 2-3 degrees Celsius. The front moved quite quickly, at approximately 40 km/h, so it was only possible to track it based on six-hourly weather station readings (the front's progress was not tracked based on daily temperatures). A cold front passed over approximately 10 overnight hours on February 1-2, with the peak temperature drop observed around 00:00-02:00 GMT, i.e., between 5:00 and 7:00 a.m. Sverdlovsk time. The front's passage was accompanied by strong winds from the west and northwest at speeds of at least 10-15 m/s from an azimuth of 270-290°. Significant precipitation was not expected, but stronger winds could have caused increased blowing of fresh snow from the mountains, heavy drifting snow, and a "ground blizzard" of previously fallen snow. A "bora"-type phenomenon could have been observed in the area of the main ridge on the eastern side—a downward drop of heavy cold air as it crossed the ridge, with winds increasing to hurricane force at 20-30 m/s below the ridge. This was the weather in the accident zone, according to Moshiashvili's analysis.
- 5 -
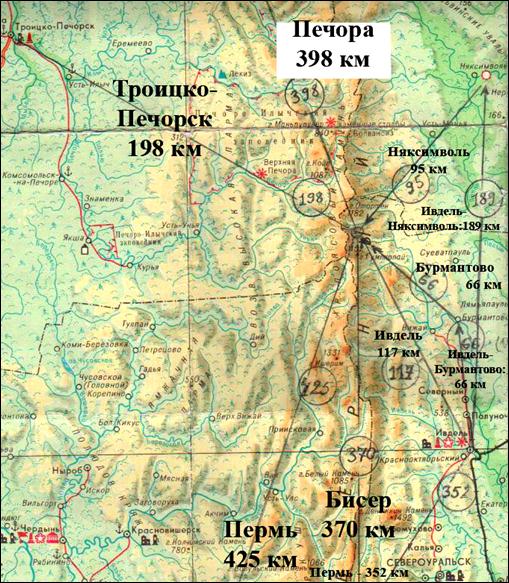
Location of weather stations relative to the accident site (distances in km to the accident site and between the weather stations closest to Ivdel according to the "Ural" tour map)
After the meteorologists' explanation, one possible reason for Dyatlov's group's halt on the slope of Mount Kholat Syakhl became clear: toward the end of daylight, the temperature began to drop and the wind began to pick up.
The group deliberately chose a section of the slope with increased snow cover to securely bury the tent in the snow to protect it from the wind. It can be seen that the thickness and condition of the snow varied greatly across the mountainside: in the depressions, the thickness was significant, on the convex slopes, the slope was almost bare of snow, and on the rocky ridges and in the hollows, the snow was blown away by the wind, exposing the rocks. The conditions for snow accumulation, snow preservation, and snow blowing from the mountain varied across the different sections. Therefore, the Dyatlov group's traces have been preserved in varying degrees: in some places, as "posts," in others, as "dents," and in others, not at all.
It is now clear that, with only ski suits and sweaters and no shoes, the group's active existence in freezing temperatures (down to -28°C) and winds (10-15 m/s) was limited to 2-3 hours, no more. The group's passive agony could have lasted somewhat longer, but it could not have changed the outcome. It merely blurred the final picture of the accident, scattering the group members and their gear.
Therefore, the presence of critical factors due to the sharp drop in temperature and increasing wind on the night of the accident should be recognized as obvious. These factors undoubtedly contributed to the group's rapid death from freezing, which was the main cause of death for most of the Dyatlov group.
The location of the weather stations is shown on the diagram, with their distance from the accident site indicated, as well as the distances from Ivdel to the weather stations.
When the windchill index drops below minus 40-45°C, the group clearly enters the danger zone, where their survival in cold conditions is reduced to a few hours, even with warm clothing and footwear. Under these conditions, the group may perish if, within the short time allotted, they are unable to find shelter from the wind, build a protected shelter, and insulate themselves sufficiently to raise the windchill index to a higher level, ensuring survival in cold conditions. In this case, it is necessary to utilize all available means of insulating themselves: find shelter from the wind, build a heated shelter, and effectively use clothing, equipment, and warm food to keep people warm.
It is important to understand that the human body's thermoregulatory system is similar in nature to that of tropical animals (monkeys). The human body isn't protected from the cold like northern animals, like polar bears and reindeer. When thermal reserves are depleted, and "cold fatigue" sets in, the human thermoregulatory system fails, and the person dies. The external organs most exposed to the cold—the extremities, skin, and external muscles—are the first to fail. Then the cold penetrates, disrupting circulation and respiration. And the cessation of circulation and respiration is the "death mechanism." Generalized depression from the cold leads to a shutdown of blood flow to the external organs and a general depression of the nervous system. The person falls asleep in the cold. The heart maintains blood flow to the brain for a while, but then both cardiac function and the brain's nutrition are disrupted. The heart loses its rhythm and stops forever.
Therefore, the lack of protection from the cold in certain environmental conditions inevitably leads to death, even with warm clothing.
Certainly, according to the forensic examination of the causes of death of the Dyatlov group, a "cold" accident due to freezing from extreme cold and wind did occur in this case. Eight of the nine Dyatlov group died from freezing, and Thibault-Brignolle also died not only from a head injury but also from the effects of low temperatures.
The "cold" accident element is definitely present in the Dyatlov accident, and its "component" appears to be quite strong. The outcome of the accident could have been far less tragic if not for the passage of a cold weather front on the night of the accident.
The investigation did not fully "track" this accident factor and did not quite correctly assess its significance in the course of the disaster.
But was an avalanche the cause of most ski tourist accidents? Were Axelrod's assertions accurate? And how were they correct, and how were they incorrect? The following two chapters answer this question. One presents conclusions based on the findings of avalanche experts, and the second provides answers using a number of examples of similar accidents involving other tourist groups, drawing on the experience of other accidents. Unfortunately, neither the Dyatlov group nor the other tourists at the time had such experience! But now it exists, and we can use it to explain events and to understand the behavior of people who find themselves in situations similar to the Dyatlov group emergency.


